

Join devRant
Do all the things like
++ or -- rants, post your own rants, comment on others' rants and build your customized dev avatar
Sign Up
Pipeless API

From the creators of devRant, Pipeless lets you power real-time personalized recommendations and activity feeds using a simple API
Learn More

So they asked if we want a wallboard or not and we answered with a NO. As you already guessed we still got a wall mounted LG TV with a small linux box.
So I started to tinker with the wallboard and created a horrible python -> HTML5/JS stuff which crawls the data worth to show and creates static pages with html5 canvas for graphs.
Later I found atlasboard which is a discontinuated dashboard from Atlassian so started to learn nodejs and rebuilt and added new widgets to show our smoketests, our mssql server metrics from zabbix, our sprint from Jira and some other servers' status.
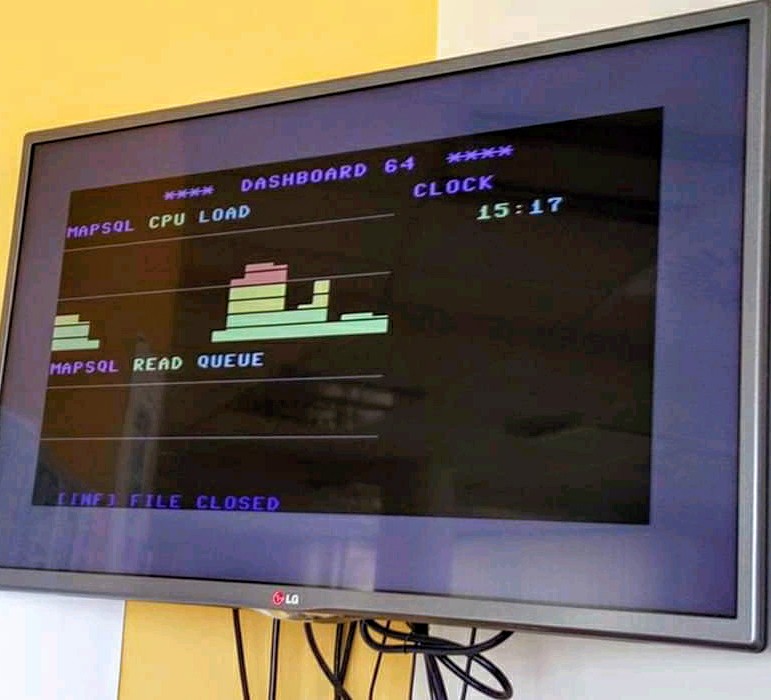
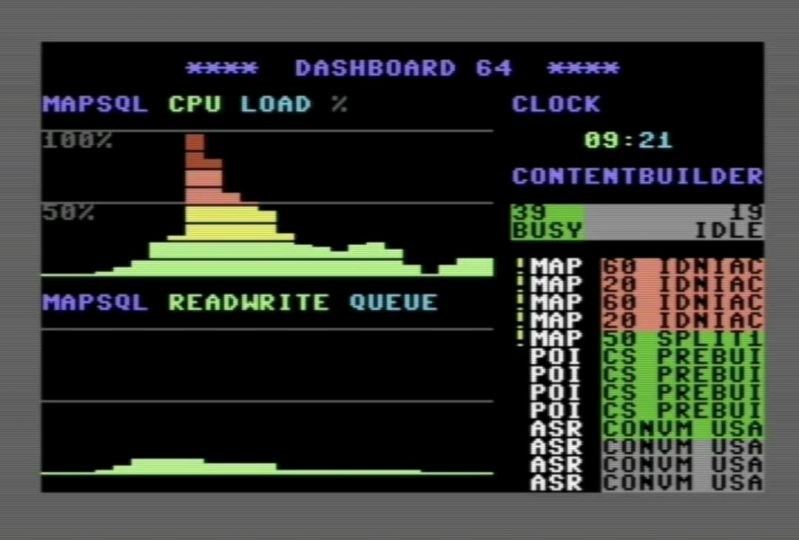
Then I created the essential metrics again but in Vice C64 emu, I collected and exported the data in python created a PETSCII compatible .prg file and the **** Dasboard 64 **** loaded and created graphs in the emu every minutes.
That was awesome! BASIC V2 is slow as hell but still awesome.
rant